Our only commercially viable electrolyzer technology relies on one of the scarcest elements on Earth
Proton exchange membrane (PEM) electrolyzers are the only technology capable of producing green hydrogen at the rates and pressures demanded by industry. The reaction takes place in two parts: first water is split into oxygen and protons at the anode, then the protons are reduced to hydrogen at the cathode. The oxygen evolution reaction (OER) is extremely slow and requires an effective catalyst. This task is so aggressive that only one catalyst survives: iridium, one of the rarest elements in the Earth's crust. To meet only the UK's initial targets for green hydrogen production would require the entire annual global production of iridium. We therefore should seek to reduce iridium usage or eliminate it entirely.

The current theoretical framework for OER catalysis has not led us to new materials
OER catalysts work by binding to water and repeatedly pulling a proton and an electron off of it, forming a series of stabilised intermediates (*OH, *O, *OOH) that eventually release oxygen gas (Fig. 2a). If any one of the intermediates binds too strongly or too weakly, the reaction slows down because the catalyst is poisoned (strong binding) or inactive (weak binding). Thus, we expect the best materials to follow 'volcano' relations - where middle binding strengths produce the most active catalysts (Fig. 2b, red line). This is very neat until you test the theory by measuring a material's performance and then using computational chemistry to calculate its binding energy descriptor. With such a poor correlation, it is hard to see a clear way forward to designing performant catalysts, let alone performant and stable catalysts!


Electrode interfaces form in unpredictable ways during operation
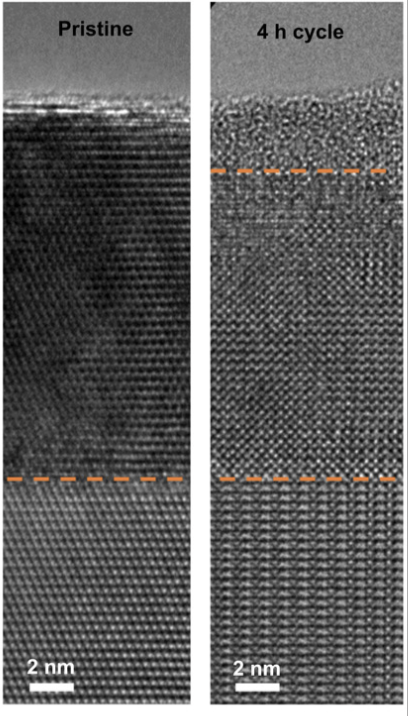
The problem with this dataset is not that anyone made a mistake. It's that the surface has to be assumed to be a non-interacting, crystalline surface made from the perfect termination of the crystal. However, surfaces are dynamic. Catalytic intermediates can interact strongly with the electrolyte, and complex layers form via the dissolution and redeposition of the catalysts back onto the surface. The most extreme example of this is the formation of an amorphous overlayer, which is very hard to calculate the properties of (Fig. 3a). For example, efforts to reduce Ir by moving from IrO2 to SrIrO3 show that an amorphous IrOxHy layer forms (Fig. 3b). We need to measure the behaviour of the surface under operating conditions to understand what is really happening.

Operando measurements are slow, so the literature is built on sparse data
Setting up any kind of operando measurement requires painstaking work. A carefully chosen model material is synthesised, a cell is assembled, and measurement is typically performed by manually controlling several separate instruments, one of the simplest examples being separately controlling a benchtop UV-vis spectrometer and a potentiostat. In the worst case scenario a user has a 4–6 hour booking and a spectrum at each potential can be acquired every half hour (Fig. 4a). This means only 8–12 spectra can be collected. As it turns out binding energy can be measured by potential-resolved UV-vis spectra (a.k.a. spectroelectrochemistry). However, the sparse data collected in this way is inherently unreliable. 4–6 hours is a very long time for a dynamic surface so systematic bias is inevitable. Sparse points and error limit this format to qualitative conclusions. The solution is to automate the measurement so that a spectrum can be collected every few seconds (Fig. 4b). This produces a reliable dense dataset that can be used to reliably extract binding energies.

Automating a series of experiments standardises experiments across labs
Every manual process we perform adds a small systematic bias. This is not anyone's fault; we have our own ways of working and seeing things. However, combined with sparse data and few samples we are left with a literature that is difficult to compare and reproduce. By chaining all our measurements together in a single automated workflow we can standardise the process and remove systematic bias. Combined with rich datasets and combinatorial libraries (where hundreds of materials are made simultaneously) we can finally build a literature that is structured and reproducible enough for deep learning. The goal of this particular project is to measure binding energies of real surfaces in a large-scale, systematic manner to ask a simple question: how well do directly measured binding energies correlate with catalytic performance? If the correlation is strong we can use binding energy as a descriptor to design new catalysts. If the correlation is weak we need to rethink our theoretical framework.